
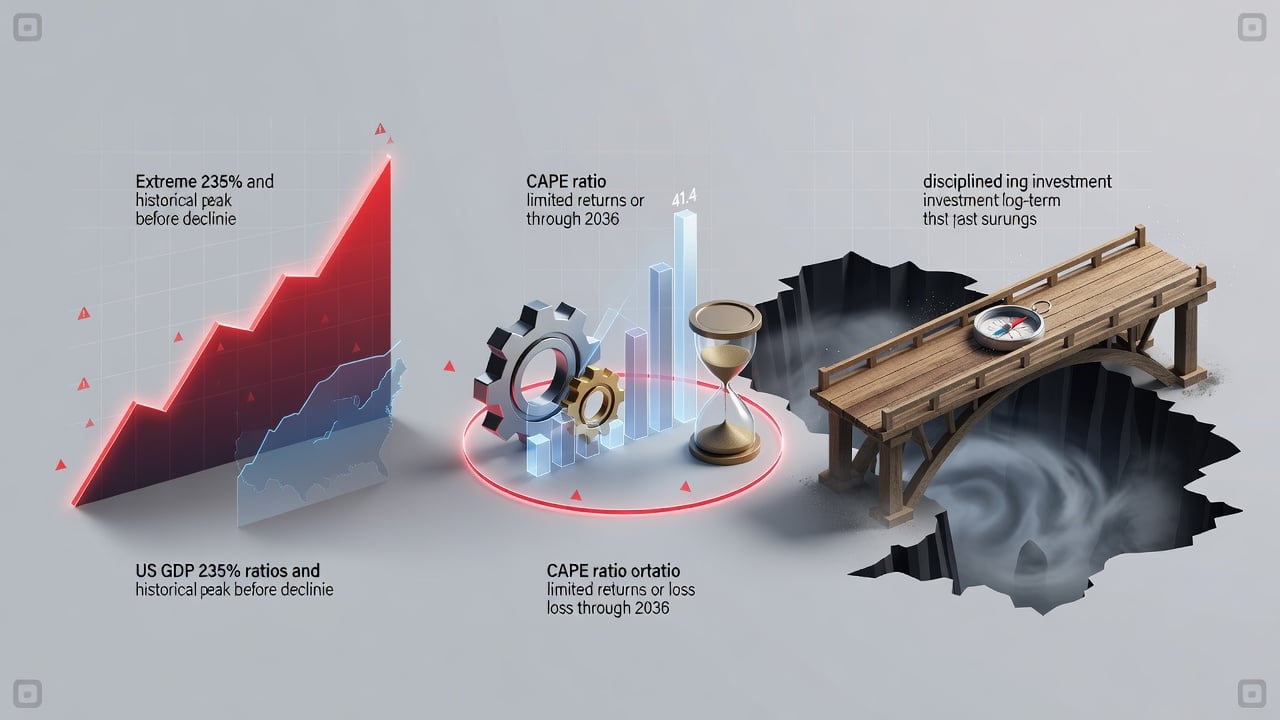
Stocks have soared for years. The S&P 500 sits near all-time highs. Yet one valuation measure stands out as a glaring alert. The Buffett Indicator, which divides total U.S. stock market capitalization by GDP, has climbed to levels never seen before. As of early July 2026, readings hover around 235%, according to GuruFocus. That’s well above the 200% danger zone Warren Buffett once highlighted.
Short. Sharp. Ominous.
This isn’t abstract theory. Data from Current Market Valuation showed the ratio at 219% as of March 31, 2026, already 2.1 standard deviations above its long-term trend. Later updates pushed it higher. Such extremes occurred only briefly around the dot-com peak. Markets then plunged.
But this time feels different. Artificial intelligence spending has concentrated gains in a handful of technology giants. The so-called Magnificent Seven drive much of the index advance. Passive investing floods money into indexes regardless of price. And corporate earnings, while solid, face questions over sustainability amid heavy capital outlays for data centers.
The Motley Fool explored this tension in a July 5 article. It noted the S&P 500’s price-to-earnings ratio reached 32 times, the highest since just before the 2020 crash. (The Motley Fool). Similar P/E peaks preceded the 2000 dot-com bust and 2008 financial crisis. History rarely offers clean repeats. Still, patterns emerge.
Valuation signals converge across multiple measures
Robert Shiller’s cyclically adjusted price-to-earnings ratio, or CAPE, tells a similar story. A July 3 Motley Fool piece pegged it at 41.4. That matches peaks from 1999 and 2000, periods when the metric had been this elevated only twice since tracking began in 1871. (The Motley Fool). Investment firm Invesco analyzed comparable starting points. Its models project negative annualized returns for the S&P 500 through 2036.
Negative. For a full decade. The forecast assumes mean reversion in valuations. Yet bulls counter that structural shifts justify higher multiples. Low interest rates for much of the past 15 years pushed investors toward equities. Massive Federal Reserve balance sheets added liquidity. And productivity gains from AI could eventually validate today’s prices.
So far, those arguments have held. The S&P 500 delivered a 325% total return over the past decade through June 2026. That compounds to roughly 15.5% annually, far above its long-term 10% average. Investors who bought at previous peaks still earned strong results if they held for 20 years or more. One quote captures the optimism: “Even if you only put money to work at the peaks of every previous bubble, you still wouldn’t have generated an impressive return over the long run. That’s the power of a long-term holding period.” (The Motley Fool).
But short-term pain can test resolve. After the dot-com bubble, the S&P 500 fell 50%. It took years to recover. The 1929 crash followed an equally frenzied period of rapid gains. A December 2025 analysis from 24/7 Wall St. noted three-year S&P 500 surges of this magnitude occurred only twice before in 153 years. Both ended badly. (24/7 Wall St.).
Recent commentary adds layers. A May 2026 Motley Fool report flagged the Buffett Indicator exceeding two standard deviations above trend, the highest on record. (The Motley Fool). Margin debt has reached extremes, per an Axios report from late May. Goldman Sachs strategist Ben Snider acknowledged froth but cautioned against precise timing. “Stocks are probably a bit frothy and could be due for a correction,” the piece summarized. (Axios).
And today? Fresh updates show no relief. GuruFocus data from July 5, 2026, confirms the ratio at 235.6%, implying roughly negative 1% annualized returns over the coming decade when dividends are included. That matches earlier projections from similar heights. Discussions on X reflect divided sentiment. Some users dismiss warnings as perennial. Others point to concentrated AI bets and slowing free cash flow as risks. One recent post noted Bank of America highlighting pressures on growth stocks from data-center costs and potential rate hikes.
Portfolio managers face hard choices. Many maintain exposure to leading technology names, betting on continued earnings growth. Others trim positions or add hedges. Dollar-cost averaging offers one practical response. By investing fixed amounts regularly, investors buy more shares when prices drop and fewer when they rise. The Motley Fool article stressed this discipline. “Continually putting money to work is the most reliable path to riches, not timing short-term corrections.”
Yet even disciplined investors feel the tension. Valuations this stretched leave little room for error. A modest earnings miss or policy surprise could trigger sharp selling. Concentration risk amplifies moves. When a few stocks dominate index returns, rotations hit harder.
Consider 2000. The CAPE ratio warned loudly. Many ignored it. The subsequent bear market wiped out trillions. Recovery took seven years for the broad index. Today’s environment shares traits. Sky-high valuations. Narrative-driven enthusiasm around a transformative technology. Retail participation at records.
But differences matter too. Corporate balance sheets appear stronger. The economy, while not perfect, avoids the housing excesses of 2007. And monetary policy retains tools unavailable two decades ago. These factors may mute the downside. They don’t eliminate it.
Wall Street research reflects nuance. Some analysts forecast single-digit returns over the next five to 10 years. Others see AI-driven productivity lifting earnings enough to grow into current prices. Both camps agree on one point. Expected returns from today’s levels fall well below recent experience.
That gap explains the warning. Not a call to sell everything. Not panic. Simply recognition that probabilities tilt toward disappointment for those expecting another decade of 15% gains. Patient capital has historically prevailed. It just sometimes waits longer than hoped.
Markets rarely move in straight lines. Pullbacks occur. So do rallies that defy logic. The current signal doesn’t predict exact timing or magnitude. It does suggest asymmetry. More downside risk than upside potential over medium-term horizons.
Investors who understand this history position accordingly. They diversify. They avoid excessive leverage. They maintain cash for opportunities. And they keep contributing to index funds through volatility. Because the alternative, sitting fully in cash waiting for the perfect entry, has its own dismal track record.
The Buffett Indicator rarely reaches these extremes. When it does, attention follows. Whether this episode ends like past ones remains unseen. What matters now is preparation. Clear-eyed assessment of risks. And a plan that survives whatever comes next.


 WebProNews is an iEntry Publication