
The numbers tell two stories at once. One sector surges. The rest stalls.
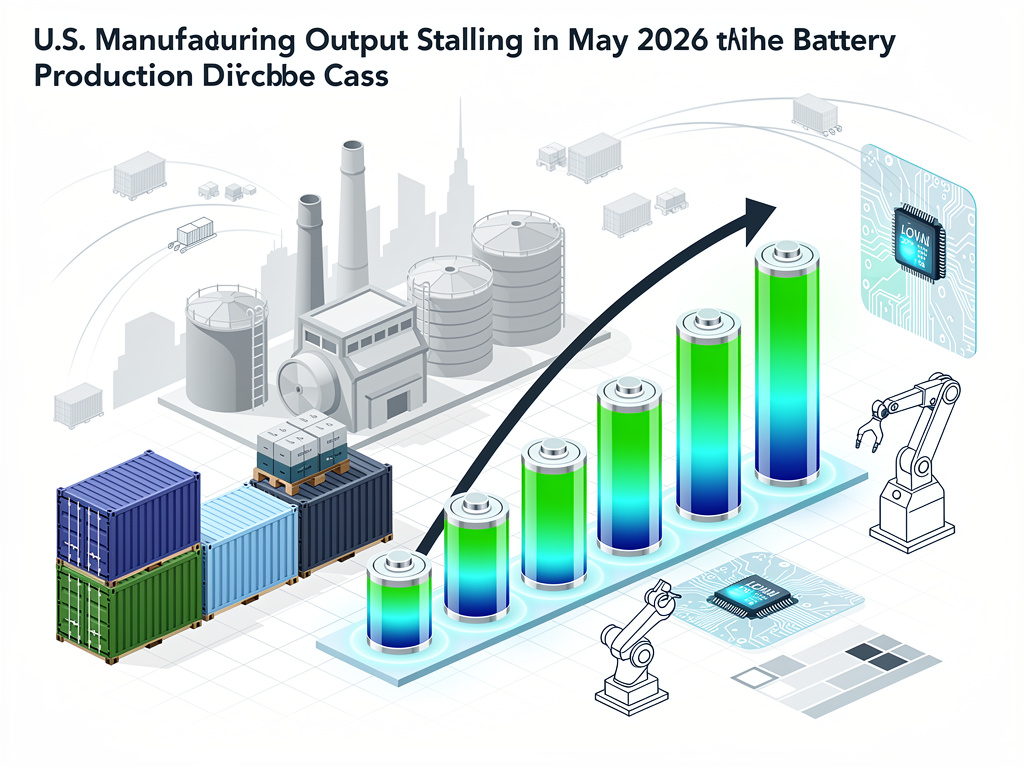
Battery manufacturing under NAICS code 33591 posted another solid gain in May. The Federal Reserve Bank of St. Louis FRED series IPG33591S shows output climbed to 239.625 in May 2026 from 237.042 in April. That index, set at 100 for 2017, has more than doubled since the base year. Gains in January through May alone lifted the reading from 224.037. Strong demand for electric vehicles and grid storage keeps factories running hot. Yet this bright spot sits inside a broader industrial picture that turned flat last month.
Total U.S. industrial production edged up just 0.1 percent in May after a revised 0.9 percent jump in April, the Federal Reserve reported on June 15. Manufacturing output showed no change at all. The Federal Reserve’s G.17 release put the manufacturing index at 97.9 percent of its 2017 average. Capacity utilization for the sector held steady at 75.7 percent, still 2.5 percentage points below its long-run average. These figures arrive at a delicate moment. Businesses stocked up earlier in the year. Geopolitical risks in the Middle East prompted some of that inventory building.
But. The pause looks temporary to many analysts. Reuters noted that factory production was unchanged in May after a hefty gain in April. Some economists pointed to preemptive ordering ahead of potential shortages and higher prices tied to conflict in the region. Samuel Tombs of Pantheon Macroeconomics told the wire service that companies appeared to front-load output. Others struck a more optimistic tone. Veronica Clark of Citigroup highlighted artificial intelligence investment as a key support for domestic production. Matthew Martin of Oxford Economics added that fiscal measures and AI tailwinds could help manufacturing turn the corner once inventories normalize.
Durable goods offered the main lift inside manufacturing. Output there rose 0.8 percent. Motor vehicles and parts advanced again. The category posted gains above 1 percent for a second month. Computer and electronic products also contributed. That sub-index climbed 0.9 percent in May and stood 10.3 percent higher than a year earlier, according to Reuters reporting on the Fed data. Nondurable goods pulled the other way. Production dropped 0.9 percent with declines across most categories.
The battery story stands apart. Its index has shown remarkable resilience across business cycles. From the early 1970s data on FRED, the series reflects both technological shifts and policy support for clean energy. Recent acceleration aligns with electric-vehicle adoption and renewable integration. No other narrow manufacturing category in the durable-goods bucket displays comparable momentum. Primary metals, wood products and nonmetallic minerals each gained more than 1 percent in May. None match the multi-year trajectory of batteries.
Overall industrial production reached 102.6 percent of its 2017 average in May. That left the yearly gain at 1.7 percent. Mining output rose 1.3 percent. Utilities slipped 0.4 percent. Capacity utilization for the entire industrial sector ticked up to 76.2 percent. The rate remains 3.2 points below its long-run average from 1972 through 2025. These readings come weeks after reports of softer March data linked to earlier global tensions. Bloomberg had reported a 0.5 percent drop in March. The rebound since then shows volatility more than weakness.
Trade policy adds another layer. Tariffs and supply-chain worries influenced some of the inventory buildup. Yet AI-related capital spending appears to offset part of that pressure. Clark’s comments to Reuters emphasized how data-center demand and related infrastructure support certain factory lines. Battery plants likely benefit twice. They feed both transportation electrification and stationary storage for renewable power that serves those same data centers.
Longer trends reveal more. The Fed plans an annual revision to industrial production and capacity indexes this autumn. That update could adjust historical figures and recent signals. For now the data paint a picture of uneven performance. Consumer-related nondurables struggle. High-tech and energy-transition segments advance. Battery output fits the second group. Its index sits more than 2.3 times the 2017 level. Few manufacturing niches have climbed so far so fast.
Economists will watch the next several releases closely. July data due in mid-August could clarify whether May’s manufacturing pause was a pause or the start of something softer. Inventory cycles often reverse. When they do, production tends to follow. Add steady gains in motor vehicles, computers and batteries. The ingredients for renewed expansion sit in place. They simply need demand to clear the stockpiles first.
Market participants already price in that possibility. Equity indexes tied to industrial firms showed limited reaction to the June 15 release. Focus has shifted toward second-quarter earnings and any policy shifts from Washington. Battery makers in particular continue to draw investor attention. Their output numbers justify the scrutiny.
The contrast could not be sharper. One narrow index climbs toward new highs. The wider factory sector holds its breath. How long that divergence lasts will shape everything from hiring plans to capital budgets. For industry insiders the message is clear. Watch the battery plants. They keep moving even when everything else slows.

