
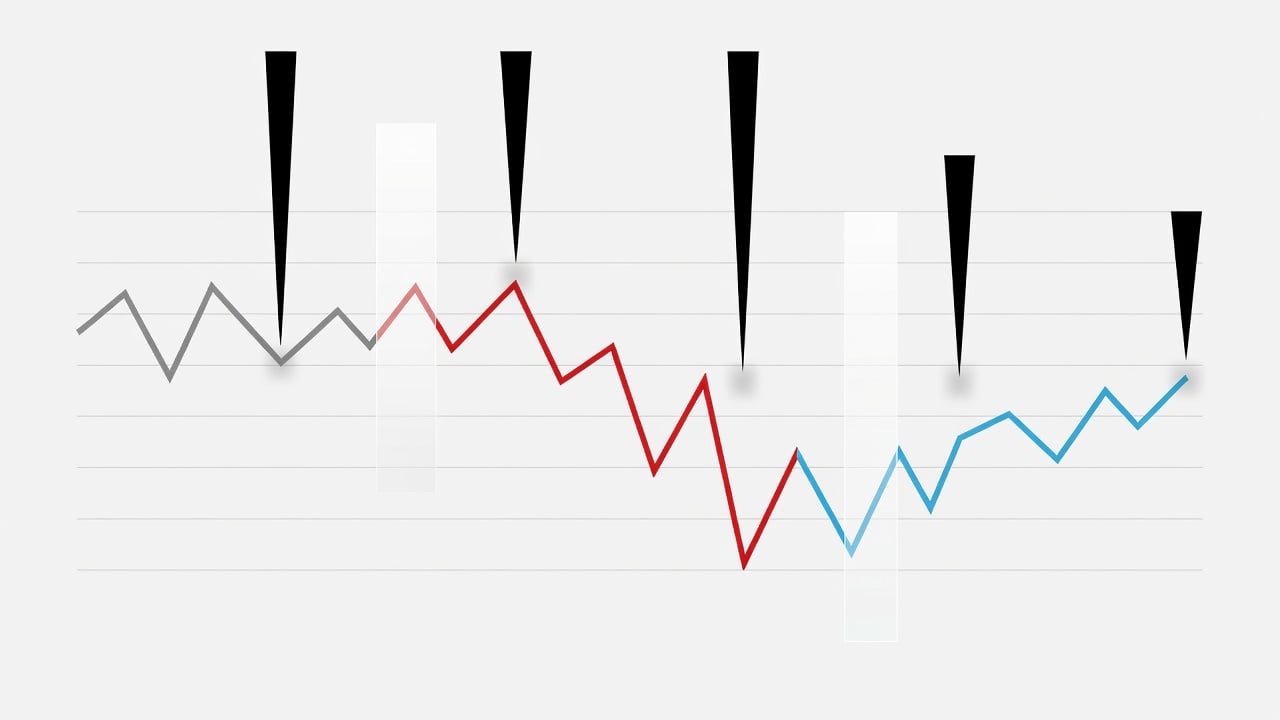
Wall Street has spent decades chasing the perfect recession forecast. Models multiply. Economists debate. Yet one straightforward measure keeps standing out. The spread between 10-year and three-month Treasury yields has turned negative ahead of every U.S. downturn since the 1960s. It flashed the warning again in 2022. Now the curve has normalized. Markets wonder what comes next.
The Motley Fool laid out the pattern clearly on July 18. Its analysis notes the indicator inverted six to 12 months before the last six recessions. Those include the sharp contractions of 1980, 1981-82, 1990-91, 2001, 2007-09 and the 2020 pandemic collapse. In each case the spread later flipped positive right before the downturn hit. Timing varied. The signal itself did not.
Short-term yields track the Fed’s policy rate closely. Three-month bills move in near lockstep with the federal funds rate. Ten-year yields price in growth and inflation expectations a decade out. When long-term rates fall below short-term ones investors price in future rate cuts. They anticipate weakness. The inversion becomes the bond market’s recession vote.
But this cycle broke the script. The 2022 inversion stretched deeper and longer than prior episodes. Inflation raged. The Fed hiked aggressively. The curve stayed inverted for more than two years, the longest stretch on record. No recession followed immediately. Gross domestic product kept expanding. The New York Fed’s recession probability model, built on the 10-year minus three-month spread, stood at 72.5 percent as of June 2026 data. Yet the economy refused to crack.
Recent readings show the spread has moved back into positive territory. The Cleveland Fed updates its yield curve model monthly. As of mid-June the probability of recession within one year sat near 13.6 percent. GDP growth forecasts hovered around 3.5 percent. Those numbers reflect a soft landing narrative gaining traction in some corners. But history cautions against quick dismissal.
False positives exist. The curve inverted briefly in 1966 without a recession. It flattened in 1998 with only a mild slowdown. The 2020 event itself arrived via external shock rather than pure cyclical forces. Still the track record holds for the post-war era. The Federal Reserve Bank of New York publishes the series. Its latest update through June 2026 keeps the probability elevated compared with long-term averages.
Why the disconnect this time? Several factors complicate the picture. Households locked in low mortgage rates before the hiking cycle. Many corporations refinanced debt at favorable terms. Fiscal stimulus remained elevated. These buffers reduced sensitivity to higher borrowing costs. U.S. Bank analysts highlighted the point in recent commentary. The economy proved less rate-sensitive than in past cycles. That resilience may have delayed any downturn.
Yet cracks appear elsewhere. Commercial real estate stress lingers. Regional banks carry unrealized losses on bond portfolios. Consumer debt levels have climbed. Corporate leverage sits high by historical standards. A sharp slowdown in hiring or renewed inflation spike could force the Fed’s hand. Bond traders price in cuts. Equity investors remain optimistic. The tension between those views keeps volatility elevated.
Market participants watch other spreads too. The 10-year minus two-year gap often draws attention. FRED data from the St. Louis Fed tracks it daily. That measure also inverted and has since steepened. GuruFocus charts show the 10-year minus one-year spread similarly normalized. Each offers nuance. None replaces the three-month benchmark’s policy link.
Nordea analysts examined the curve’s slope in recent research. They place the next recession roughly 15 to 28 months away based on current pricing. That timeline points to late 2027 or 2028. Such projections carry wide error bands. They illustrate how the signal now points further out than the classic six-to-12-month window.
Advisor Perspectives published a Treasury yields snapshot on July 10. It noted the curve’s move toward normalization. A follow-up on July 17 reinforced the steepening trend. These updates capture daily shifts. They remind investors the signal evolves in real time. One day of positive spread does not erase prior inversion depth.
Economists at the Cleveland Fed emphasize the predictive power still holds across eight recessions when measured properly. Their model incorporates past GDP outcomes and yield spreads. Recent outputs show modest growth and contained recession odds. But the rule of thumb persists. Inversion typically precedes slowdown by about a year.
Texas Real Estate Research Center reviewed the evidence. Its analysis finds the relationship between inversions and recessions remains well established. Exact timing proves harder to pin down. The lag can stretch from months to nearly two years. That variability explains why some forecasters now eye 2027.
Public discussion on X reflects divided views. Macro strategist Henrik Zeberg posted in early July that his business cycle indicator entered contraction phase. Traditional recession probability models showed only 5 percent odds at the time. He warned against complacency. Other users noted the lowest recession probability readings since 2022 even as parts of the curve linger near inversion levels.
One trader highlighted a proprietary signal suggesting the 2-year/10-year curve could reinvert by late 2027. Such forecasts remain speculative. They underscore ongoing uncertainty. The bond market has spoken before. It may simply be taking longer this cycle.
Investors face a familiar dilemma. Ignore the indicator and risk surprise. Overweight it and miss years of gains. The 2022-2025 period tested many portfolios. Stocks climbed despite inversion. Bonds suffered. Diversification mattered more than ever.
Corporate leaders weigh the data too. Capital expenditure plans hinge on growth outlooks. Hiring freezes or expansions follow the same logic. Consumer confidence surveys show mixed signals. Some households retrench. Others spend freely on services.
Fed officials monitor the curve among many inputs. They set policy on inflation, employment and financial conditions. Recent speeches flag persistent inflation risks. One July report from The Motley Fool noted the central bank highlighting fresh price pressures that could rattle markets. Rate cut expectations have shifted repeatedly this year.
Buffett’s cautionary tone in recent interviews adds another layer. The Oracle of Omaha has warned of market trouble ahead. His conglomerate’s cash pile speaks volumes. Other hedge fund managers adjust exposure based on similar concerns.
So what should investors do? History suggests caution when the signal aligns with past patterns. The current window matches the typical post-inversion period. Yet unique circumstances may extend the expansion. No single indicator works in isolation.
Combine the yield curve with unemployment trends, credit spreads, manufacturing data. Watch for coincident signals. The yield curve excels at forecasting. It rarely specifies the trigger or severity.
Portfolio adjustments follow risk tolerance. Some tilt toward defensives. Others maintain equity exposure with hedges. Cash or short-duration bonds offer ballast. Real assets provide inflation protection. The right mix depends on time horizon and objectives.
One truth endures. Recessions arrive irregularly. Preparation beats prediction. The Treasury market’s longest-running recession indicator just entered its historical danger zone. Whether 2026 brings slowdown or further resilience remains unseen. Markets will keep debating. The curve will keep signaling.
And the data keeps coming. New York Fed updates arrive monthly. Cleveland Fed revises its GDP probability each month. FRED series refresh daily. Investors who track these sources gain edge. They avoid relying on headlines alone.
The 2022 inversion tested the indicator’s reputation. Its normalization without immediate recession fueled doubters. Yet the full record since 1960 shows remarkable consistency. Six recessions. Six prior signals. The seventh test unfolds now.
Prudent observers stay alert. They recognize lags can stretch. They acknowledge structural changes in the economy. Most of all they respect the message embedded in Treasury pricing. It has rarely misled for long.


 WebProNews is an iEntry Publication