
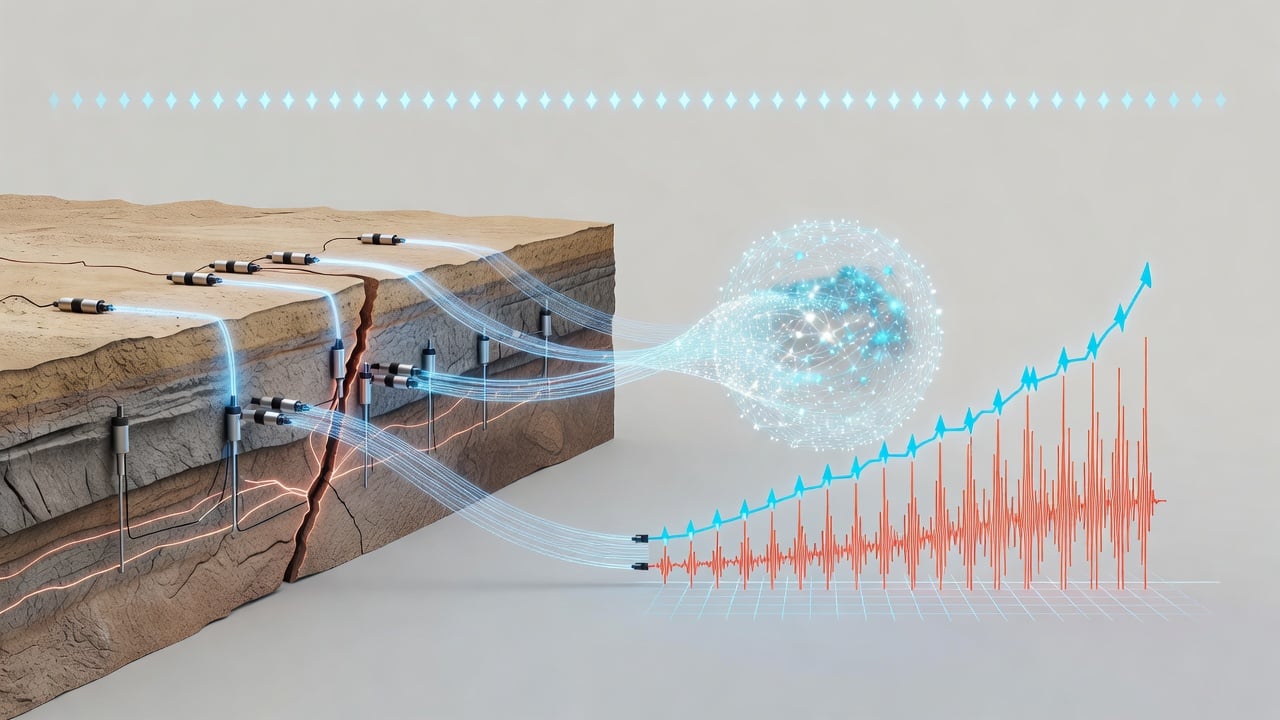
California’s San Andreas Fault has long stood as one of the most closely watched geological features on the planet. Seismologists monitor it with networks of sensors, hoping for any clue that might hint at when the next major rupture could strike. Yet much of what happens along the fault slips by unnoticed. Slow movements that release stress without generating the sharp seismic waves picked up by traditional instruments have remained largely invisible. Until now.
Researchers deployed artificial intelligence on years of strainmeter data from the Parkfield section of the fault. The results revealed 92 short-duration slow slip events between 2009 and 2016. These events, lasting just hours in many cases, had escaped detection by conventional analysis. And they weren’t random. Each tended to precede a noticeable uptick in low-frequency earthquake activity nearby.
Gizmodo first reported the findings, drawing from a study published in Nature Communications. Lead author Zahra Zali, a geophysicist, put the challenge plainly. “We wanted to know if important slow displacement processes might be hidden in years of continuous deformation measurements. Artificial intelligence enabled us to recognize their patterns, which would otherwise have gone unnoticed.”
The data came from four highly sensitive borehole strainmeters. These instruments measure tiny changes in rock deformation over timescales from seconds to weeks. Traditional seismometers miss the slow slips because they produce no shaking. GPS stations lack the resolution for such brief, subtle shifts. The AI bridged that gap. It sifted through an enormous dataset, spotting signals buried in background noise.
But the implications stretch beyond Parkfield. Slow slip events appear to modulate stress on the fault. They don’t cause immediate damage. They do, however, alter conditions that can influence when and where ordinary earthquakes occur. “Our results show that these ‘earthquakes in slow motion’ are not isolated phenomena,” said co-author Patricia Martínez-Garzón of the GFZ Helmholtz Centre for Geosciences. The work suggests fault slip exists on a continuum. From silent deformation all the way to sudden, destructive breaks.
Just yesterday, Phys.org covered the same research, highlighting collaboration with David Mencin of EarthScope and Gregory C. Beroza of Stanford University. The team documented a systematic pattern. Slow slips were followed by increased low-frequency seismicity within about 10 kilometers and at depths shallower than 20 kilometers. The events themselves scale with moment and duration in ways that echo regular earthquakes. Only slower. Much slower.
This matters because the San Andreas doesn’t behave in isolation. Recent studies paint a sobering picture for Southern California as a whole. Stress levels along the San Andreas and neighboring San Jacinto faults have climbed to heights not seen in the last 1,000 years. A June paper from the University of Hawaiʻi at Mānoa, reported across outlets including CNN and LAist, identified Cajon Pass as a potential “earthquake gate.” Should a rupture reach that junction, it could cascade across both fault systems. The result would be far more extensive damage than a single-fault event.
Yet the new AI-driven discovery adds nuance. Slow slips might act as safety valves in some places. Or they could prime sections for failure in others. Scientists have only begun to map these relationships. The Parkfield segment, long considered a repeating earthquake patch with magnitude 6 events roughly every 20 years, offers a natural laboratory. The last major quake there struck in 2004. Seismic activity has remained relatively quiet since. The hidden slow slips could help explain why.
Zali’s team trained machine learning models specifically for this task. Conventional statistical methods had failed to pull the faint signals from the data deluge. The AI succeeded by learning subtle patterns across multiple strainmeter channels simultaneously. It flagged events that human analysts or simpler algorithms overlooked. And it did so consistently across the eight-year record.
Critics might wonder whether 92 events constitute a robust sample. The researchers acknowledge the imbalance. They cataloged roughly 500,000 low-frequency earthquakes in the same period. The slow slips remain rarer. Still, the correlation holds. When slow slip occurs, low-frequency activity rises in the days that follow. The pattern repeats often enough to suggest cause and effect rather than coincidence.
And the timing feels urgent. California faces growing exposure. Population density has increased along fault traces. Infrastructure has aged. Preparedness campaigns remind residents to secure furniture and stock supplies. But those messages assume the next quake will arrive with some warning. Current science offers none. This research doesn’t change that overnight. It does, however, point toward a richer observational toolkit.
Future work will test the approach on other faults. The Cascadia subduction zone, the Hayward Fault in the Bay Area, even international sites with dense instrumentation. If the method generalizes, seismologists could gain a new class of precursors. Not predictions. Not yet. But indicators of changing stress conditions that today remain invisible.
The study also reframes how experts think about fault behavior. For decades the field drew sharp lines. Seismic versus aseismic. Fast rupture versus slow creep. Data from the past 15 years have blurred those boundaries. Slow slip events in Cascadia can last weeks and span hundreds of kilometers. The Parkfield versions are shorter and smaller. Yet both belong to the same family. Understanding the differences may prove as valuable as the similarities.
Beroza, a co-author with decades of experience on the San Andreas, has long advocated for better instrumentation and analysis. Strainmeters are expensive to install and maintain. Only a handful operate at the necessary sensitivity. Expanding the network while deploying AI to monitor it in real time could transform hazard assessment. The computational demands are manageable. Modern models run efficiently once trained.
Of course, no single paper resolves the prediction problem. The U.S. Geological Survey’s position remains unchanged. True forecasting of major earthquakes lies beyond current capabilities. This work, though, chips away at the unknowns. It shows that faults talk to themselves in frequencies and styles that humans have struggled to hear. With the right tools, those conversations become audible.
Residents of California live with the fault every day. They drive across it. Build homes beside it. Accept a baseline risk that feels both abstract and ever-present. Discoveries like this one don’t heighten that risk. They illuminate the mechanisms behind it. And illumination, over time, can lead to better models, sharper warnings, and perhaps even actionable forecasts.
The paper appears in Nature Communications under the title “Slow slip modulates low-frequency seismicity on the Parkfield segment of the San Andreas Fault.” Zali and colleagues have made the data and code available for other researchers to replicate and extend. That openness accelerates progress. Other teams can now apply similar AI techniques to their own datasets.
Meanwhile, stress continues to accumulate. The southern San Andreas has not produced a great earthquake since 1857. The clock keeps ticking. Slow slips may be releasing fractions of that energy. Or they may be concentrating it in locked patches. Only sustained observation will tell. Thanks to advances in machine learning, that observation just became considerably more perceptive.
The next step involves scaling up. More sensors. Longer records. Integration with other data streams such as satellite radar and groundwater monitoring. If slow slip events prove widespread and detectable in near real time, emergency managers could gain hours or days of heightened awareness before larger seismic swarms develop. Not a crystal ball. But a better ear to the ground.


 WebProNews is an iEntry Publication