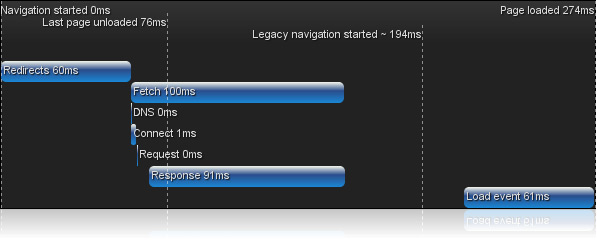
As you probably know by now, Google considers page speed as one of its many signals for search engine rankings. With that in mind, you may also be interested in knowing that in Chrome 6, developers can access web timing metrics for measuring web page load time across browsers.
"Measuring web page load time is a notoriously tricky but important endeavor," says Google software engineer Tony Gentilcore. "One of the most common challenges is simply getting a true start time. Historically, the earliest a web page could reliably begin measurement is when the browser begins to parse an HTML document (by marking a start time in a <script> block at the top of the document)."
"Unfortunately, that is too late to include a significant portion of the time web surfers spend waiting for the page: much of the time is spent fetching the page from the web server," says Gentilcore. "To address this shortcoming, some clever web developers work around the problem by storing the navigation start time in a cookie during the previous page’s onbeforeunload handler. However, this doesn’t work for the critical first page load which likely has a cold cache."

Genticore has more details (as well as an explanation of the above image) in this post.
Web Timing metrics can be found under window.webkitPerformance in Chrome 6. Google is kind enough to point out where they can be found in other browsers as well: window.msPerformance in the third platform preview of IE 9 and soon window.mozPerformance in Firefox.


 WebProNews is an iEntry Publication